import numpy as np
import matplotlib.pyplot as plt
from scipy.stats import normSession Details
- Date: [Day of week], [Month] [Day], [Year]
- Time: [Start time]–[End time] ([morning/afternoon/evening] session)
- Location: [Venue or virtual platform]
- Instructor: [Instructor Name]
Embedding Python code into the website
Loading packages
Code chunks
# Parameters of the normal distribution
mu = 0      # mean
sigma = 1   # standard deviation
n_samples = 1000

# Sample from the distribution
samples = np.random.normal(mu, sigma, n_samples)

# Plot the true PDF
x = np.linspace(mu - 4*sigma, mu + 4*sigma, 1000)
pdf = norm.pdf(x, mu, sigma)
Cross reference figures
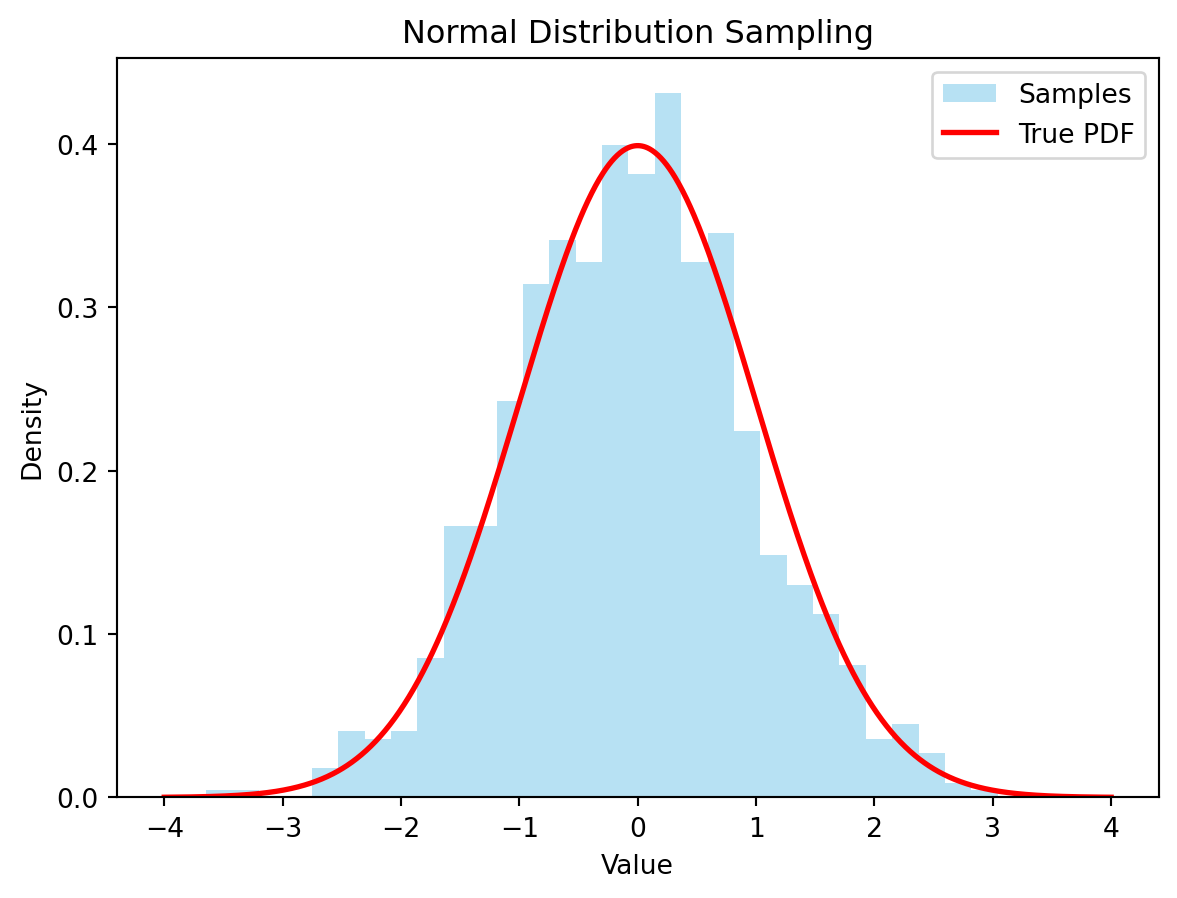
You can add special tags to be able to create links to figures. See Figure 1 for details.
Code
# Plot histogram of samples
plt.hist(samples, bins=30, density=True, alpha=0.6, color="skyblue", label="Samples")

plt.plot(x, pdf, "r-", lw=2, label="True PDF")

plt.title("Normal Distribution Sampling")
plt.xlabel("Value")
plt.ylabel("Density")
plt.legend()
plt.show()